
Ortega-Pythia Portfolio Case Study
A public-safe walkthrough of a real portfolio run through Pythia: what $800 of original capital became, the attribution, the saved reads behind the trades, and claim hygiene.
The Short Version
This is the Portfolio 8 case study, frozen at June 13, 2026. Real money, $800.00 of it, sized small on purpose, with the research, valuations, and trade decisions saved inside Pythia as they happened. It reads like a report because it is one. The opinions and the mistakes are mine.
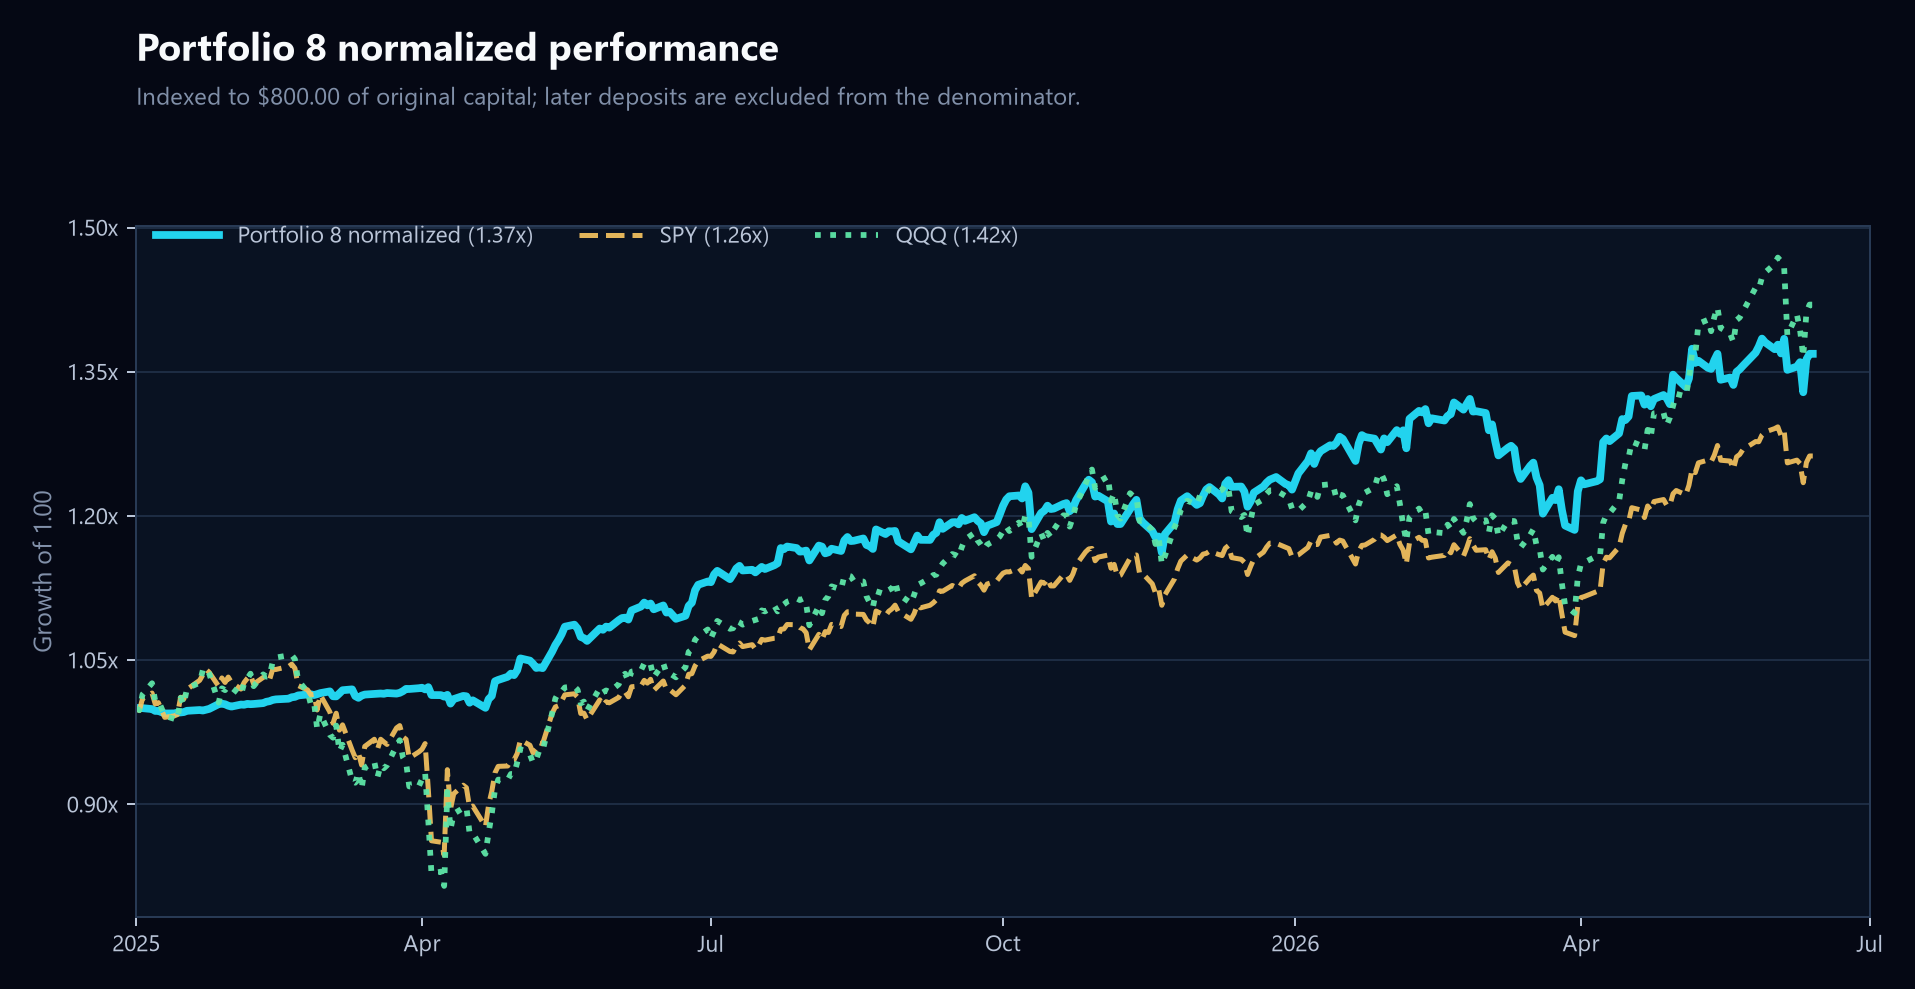
- January 1, 2025 to June 13, 2026: +36.87% (+3,687 bps), ending at 1.3687x.
- January 1, 2026 to June 13, 2026: +11.52% (+1,152 bps), ending at 1.1152x.
Before any chart, the ground rule: $800.00 of original capital is the portfolio. That is the money that bought every position in this report, and every return you are about to read is measured on the ledger it built.
How I Am Counting The Money
Simple rules. The original capital is $800.00. Every position in this book was bought out of that money, and every return on this page is measured on the ledger it built. Both windows are start-to-end returns on that ledger; each row in the table re-indexes from its own start date.
1 later cash-flow row is dated in the source notes and excluded from the return math. Money that never bought a position does not get to move a performance number in either direction.
As of the report date, 94.2% of the original capital is in the market. The rest is the loose change the trade sizes left behind, not a cash strategy.
The Two Windows
| Window | Start | End | Return % | Return bps | End index |
|---|---|---|---|---|---|
| January 1, 2025 to June 13, 2026 | January 1, 2025 | June 13, 2026 | +36.87% | +3,687 bps | 1.3687x |
| January 1, 2026 to June 13, 2026 | January 1, 2026 | June 13, 2026 | +11.52% | +1,152 bps | 1.1152x |
The benchmark chart keeps this honest. Over the full window, Portfolio 8 finished at 1.3687x (+36.87%), SPY at 1.2624x (+26.24%), and QQQ at 1.4199x (+41.99%). Ahead of SPY, behind QQQ. I am not spinning either half of that sentence.
What Helped And What Hurt
This is the part I care about more than the headline. Contribution is ranked in basis points of the normalized window, not raw dollars, and the losers stay in the table. If the winners are public and the losers are hidden, the whole post is useless.
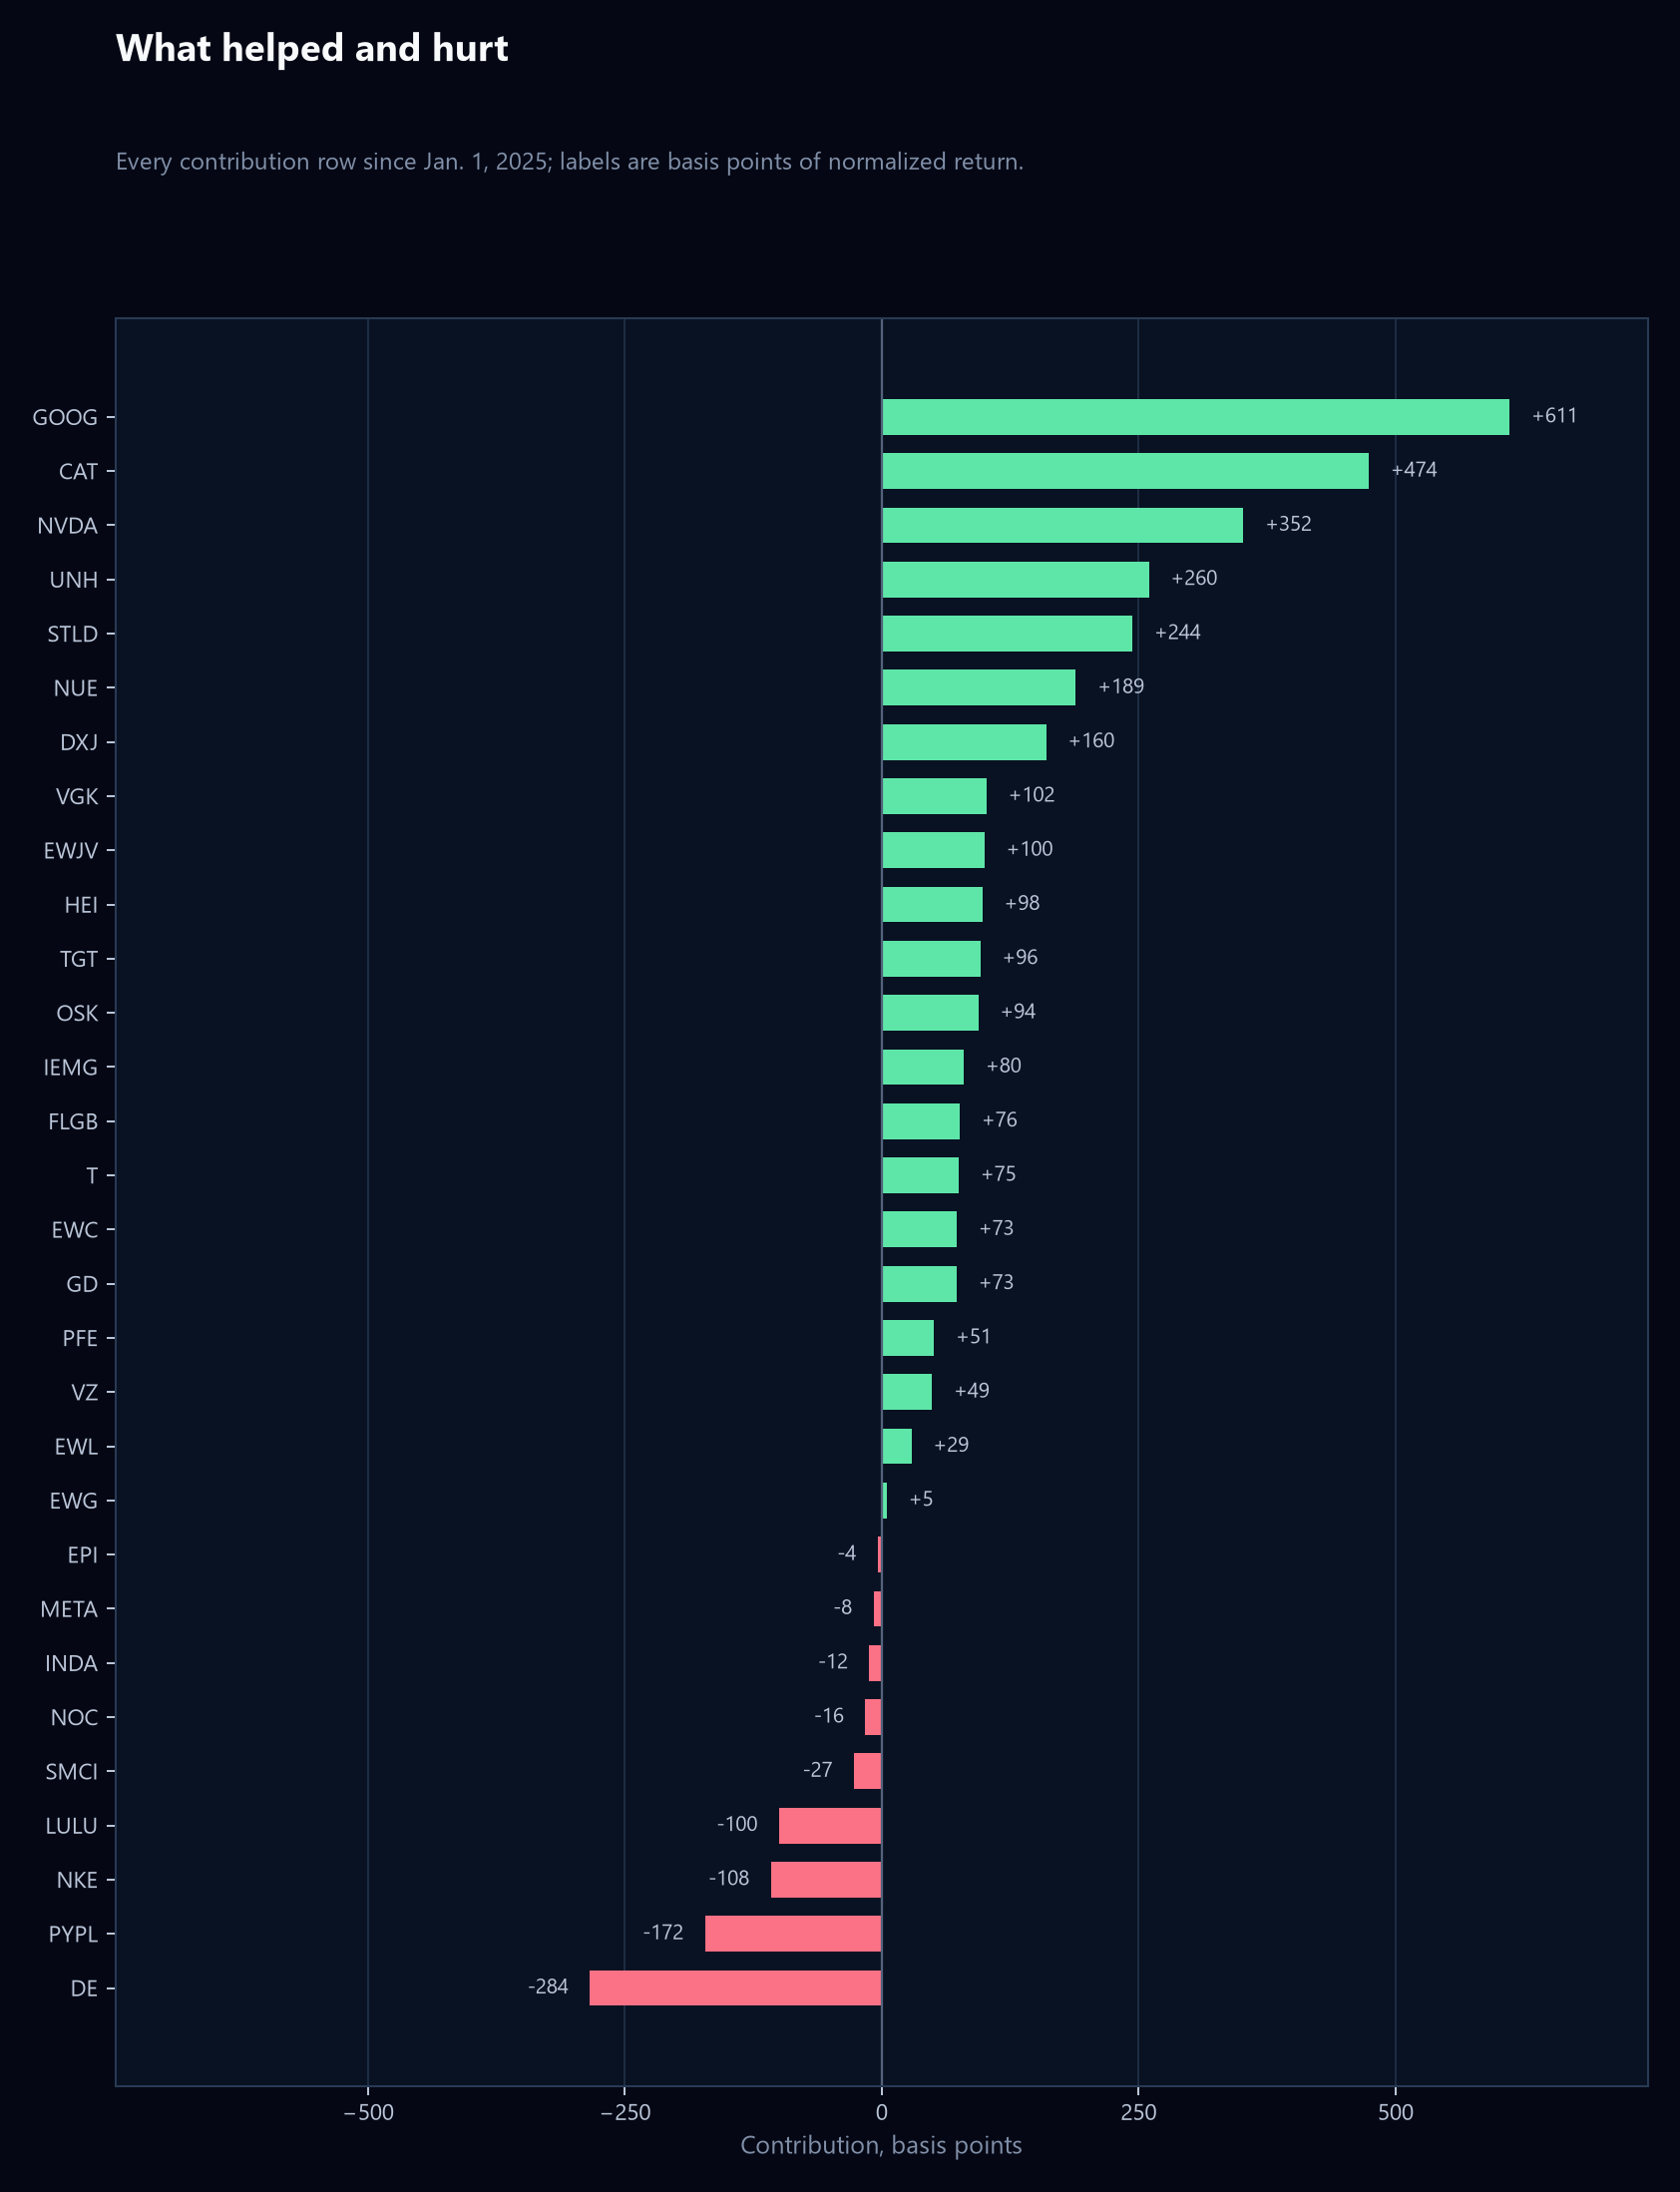
| Ticker | Window | Return % | Contribution bps | First trade | Signal |
|---|---|---|---|---|---|
| GOOG | Since January 1, 2025 | +124.0% | +769 bps | April 9, 2025 | BUY |
| CAT | Since January 1, 2025 | +206.1% | +639 bps | April 23, 2025 | HOLD |
| NVDA | Since January 1, 2025 | +104.4% | +453 bps | April 22, 2025 | SELL |
| STLD | Since January 1, 2025 | +132.2% | +328 bps | April 23, 2025 | BUY |
| NUE | Since January 1, 2025 | +138.3% | +257 bps | April 23, 2025 | BUY |
| PYPL | Since January 1, 2025 | -40.4% | -205 bps | August 15, 2025 | BUY |
| NKE | Since January 1, 2025 | -41.7% | -132 bps | August 15, 2025 | SELL |
| LULU | Since January 1, 2025 | -40.2% | -127 bps | August 15, 2025 | BUY |
| SMCI | Since January 1, 2025 | -9.6% | -24 bps | April 23, 2025 | HOLD |
| NOC | Since January 1, 2025 | -6.3% | -16 bps | September 5, 2025 | BUY |
What Pythia Read Before The Trades
The loop behind every saved read is the same. Deterministic valuation fabrics run first: a DCF on free cash flow, a weighted fair-value blend, a margin of safety against the current price. The LLM synthesis sits on top of that evidence and writes the thesis, and the thesis gets saved with its signal, the metrics to watch, and the conditions that would break it. The AI layer synthesizes. It is not the source of truth.
Below is what was actually on file for the names that moved this portfolio, and what happened next. Saved dates and timing matter here: a read saved after entry is a review, not a prediction, and the rows say which is which.
GOOG: saved read BUY
- Receipt: curated thesis, saved September 3, 2025 (after entry).
- The number the read hung on: Margin of Safety (MoS) from DCF: +19.3%.
- What Pythia said would break the thesis: Failure to generate high-margin revenue and a commensurate return on investment from the massive capital expenditure cycle (~[redacted]B in 2025).
- What actually happened: +124.0% position return, +769 bps of contribution.
- Reconciliation: Winner: performance is currently confirming the saved BUY thesis.
CAT: saved read HOLD
- Receipt: curated thesis, saved September 3, 2025 (after entry).
- The number the read hung on: Margin of safety (MoS): -42.8%.
- What Pythia said would break the thesis: The secular growth in the Energy & Transportation (E&T) segment, particularly from data centers, falters or fails to offset the cyclical decline in the Construction and Resources segments.
- What actually happened: +206.1% position return, +639 bps of contribution.
- Reconciliation: Winner: performance outpaced the saved HOLD stance; thesis may have been too conservative.
NVDA: saved read SELL
- Receipt: curated thesis, saved August 9, 2025 (after entry).
- The number the read hung on: Margin of Safety (MoS) based on DCF FCFF: -321%.
- What Pythia said would break the thesis: The recent, severe quarterly gross margin contraction proves to be a one-off anomaly, with margins quickly rebounding to and sustaining previous peak levels.
- What actually happened: +104.4% position return, +453 bps of contribution.
- Reconciliation: Winner: performance contradicted the saved SELL thesis; reassess the overvaluation/risk case.
STLD: saved read BUY
- Receipt: curated thesis, saved September 3, 2025 (after entry).
- The number the read hung on: Margin of Safety (MoS): over 50% (specifically 51.2%).
- What Pythia said would break the thesis: Significant delays, cost overruns, or failure to achieve targeted utilization and profitability at the new aluminum flat-rolled facility, preventing it from delivering its expected ~[redacted]M-[redacted]M in through-cycle EBIT...
- What actually happened: +132.2% position return, +328 bps of contribution.
- Reconciliation: Winner: performance is currently confirming the saved BUY thesis.
NUE: saved read BUY
- Receipt: curated thesis, saved September 3, 2025 (after entry).
- The number the read hung on: Potential upside: approximately 25%.
- What Pythia said would break the thesis: A severe global recession or a "hard landing" in the U.S. economy stifles steel demand, preventing the expected recovery and returns on new investments.
- What actually happened: +138.3% position return, +257 bps of contribution.
- Reconciliation: Winner: performance is currently confirming the saved BUY thesis.
TGT: saved read HOLD
- Receipt: curated thesis, saved September 3, 2025 (before or on entry).
- The number the read hung on: Margin of Safety (DCF FCFF): 28% (also cited as +27.9%).
- What Pythia said would break the thesis: A prolonged period of negative sales growth and margin pressure, exceeding management's already reduced guidance.
- What actually happened: +45.1% position return, +224 bps of contribution.
- Reconciliation: Winner: performance outpaced the saved HOLD stance; thesis may have been too conservative.
PYPL: saved read BUY
- Receipt: curated thesis, saved August 9, 2025 (before or on entry).
- The number the read hung on: Margin of Safety (MoS) from DCF model: +32.8%.
- What Pythia said would break the thesis: The new management team fails to execute its operational turnaround, specifically being unable to stabilize and improve gross margins.
- What actually happened: -40.4% position return, -205 bps of contribution.
- Reconciliation: Negative but small: monitor against the saved BUY thesis breakers.
DXJ: no saved read
- Receipt: nothing on file. This position skipped the pipeline, which is on me, not the system.
- What actually happened: +63.5% position return, +197 bps of contribution.
- Reconciliation: Winner: performance is positive, but the saved thesis stance is not explicit.
Buy/Sell Timing
Timing is measured from each public-safe trade date to the report date. I am not showing prices or unit counts; the point is whether buys and sells line up with later price movement and saved analysis context. Every validated timing row is shown.
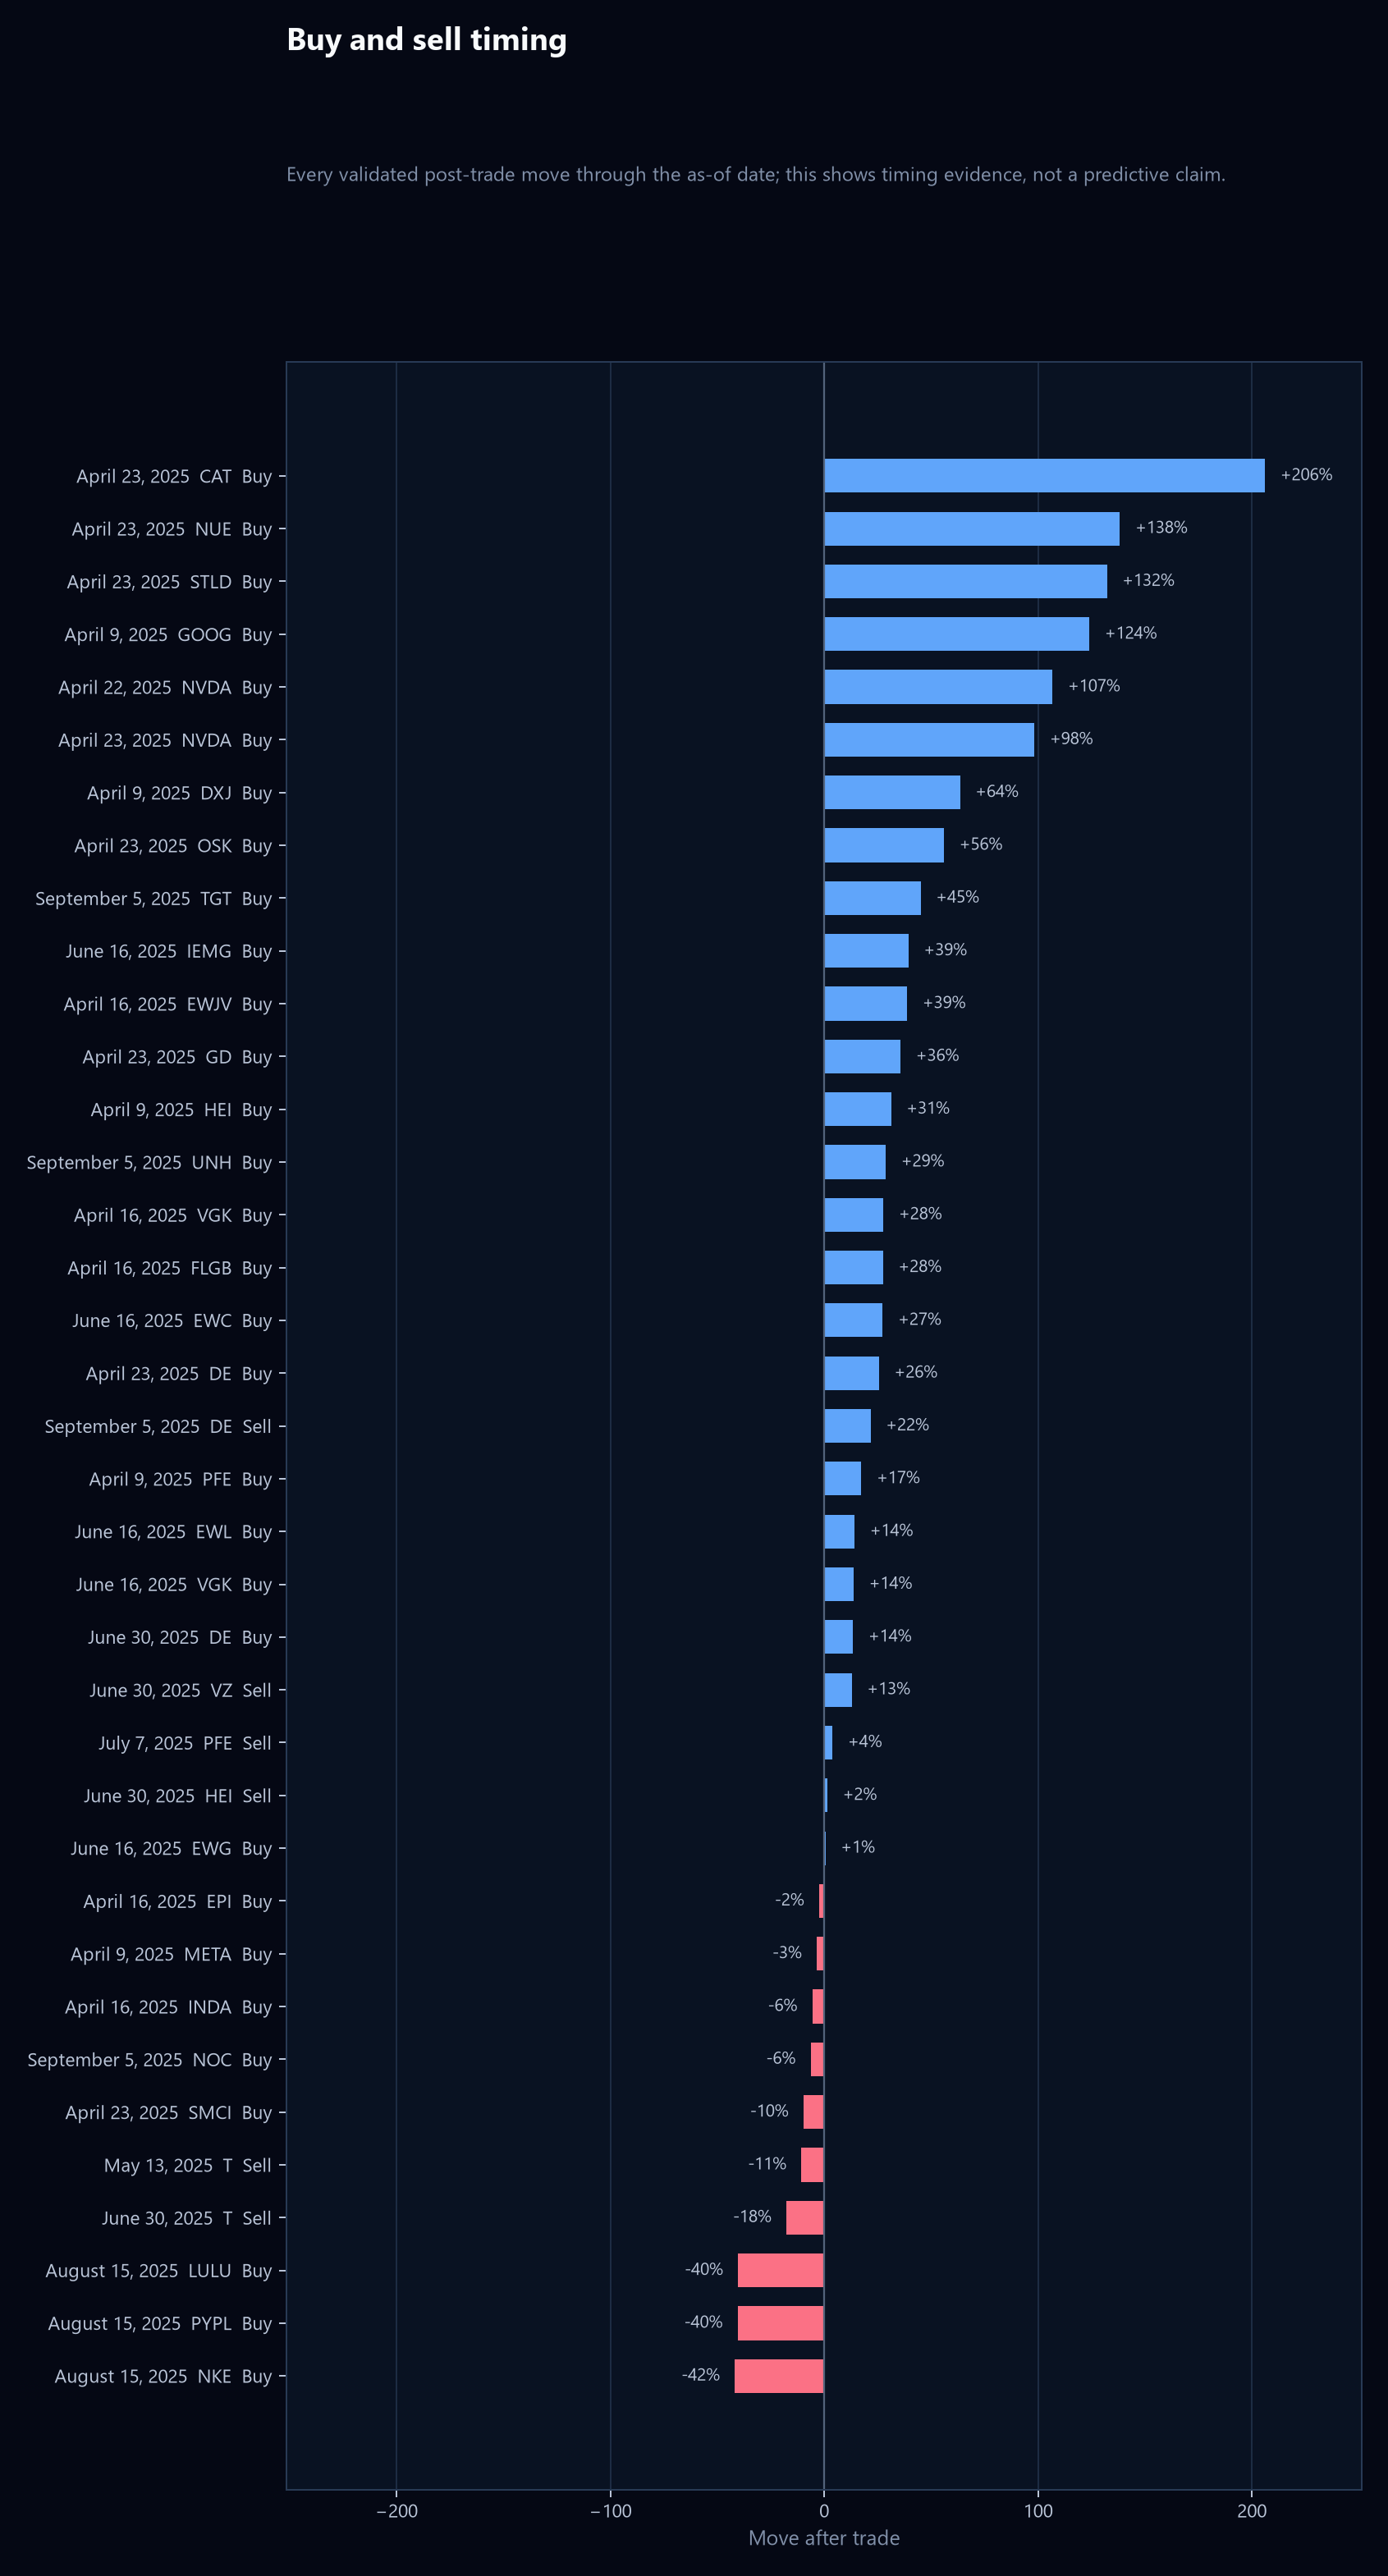
| Date | Ticker | Action | Move after trade % | Analysis timing | Signal |
|---|---|---|---|---|---|
| April 9, 2025 | DXJ | Buy | +63.5% | No saved analysis | No saved signal |
| April 9, 2025 | GOOG | Buy | +124.0% | After entry | BUY |
| April 9, 2025 | HEI | Buy | +31.3% | After entry | BUY |
| April 9, 2025 | META | Buy | -3.4% | After entry | HOLD |
| April 9, 2025 | PFE | Buy | +17.4% | After entry | BUY |
| April 16, 2025 | EPI | Buy | -2.3% | No saved analysis | No saved signal |
| April 16, 2025 | EWJV | Buy | +38.8% | No saved analysis | No saved signal |
| April 16, 2025 | FLGB | Buy | +27.5% | No saved analysis | No saved signal |
| April 16, 2025 | INDA | Buy | -5.5% | No saved analysis | No saved signal |
| April 16, 2025 | VGK | Buy | +27.7% | No saved analysis | No saved signal |
| April 22, 2025 | NVDA | Buy | +106.8% | After entry | SELL |
| April 23, 2025 | CAT | Buy | +206.1% | After entry | HOLD |
| April 23, 2025 | DE | Buy | +25.6% | No saved analysis | No saved signal |
| April 23, 2025 | GD | Buy | +35.7% | After entry | HOLD |
| April 23, 2025 | NUE | Buy | +138.3% | After entry | BUY |
| April 23, 2025 | NVDA | Buy | +98.3% | After entry | SELL |
| April 23, 2025 | OSK | Buy | +56.0% | After entry | HOLD |
| April 23, 2025 | SMCI | Buy | -9.6% | After entry | HOLD |
| April 23, 2025 | STLD | Buy | +132.2% | After entry | BUY |
| May 13, 2025 | T | Sell | -10.6% | After entry | HOLD |
| June 16, 2025 | EWC | Buy | +27.4% | No saved analysis | No saved signal |
| June 16, 2025 | EWG | Buy | +0.6% | No saved analysis | No saved signal |
| June 16, 2025 | EWL | Buy | +14.2% | No saved analysis | No saved signal |
| June 16, 2025 | IEMG | Buy | +39.4% | No saved analysis | No saved signal |
| June 16, 2025 | VGK | Buy | +13.8% | No saved analysis | No saved signal |
| June 30, 2025 | DE | Buy | +13.5% | No saved analysis | No saved signal |
| June 30, 2025 | HEI | Sell | +1.5% | After entry | BUY |
| June 30, 2025 | T | Sell | -17.6% | After entry | HOLD |
| June 30, 2025 | VZ | Sell | +12.9% | After entry | BUY |
| July 7, 2025 | PFE | Sell | +3.9% | After entry | BUY |
| August 15, 2025 | LULU | Buy | -40.2% | After entry | BUY |
| August 15, 2025 | NKE | Buy | -41.7% | Before or on entry | SELL |
| August 15, 2025 | PYPL | Buy | -40.4% | Before or on entry | BUY |
| September 5, 2025 | DE | Sell | +21.7% | No saved analysis | No saved signal |
| September 5, 2025 | NOC | Buy | -6.3% | Before or on entry | BUY |
| September 5, 2025 | TGT | Buy | +45.1% | Before or on entry | HOLD |
| September 5, 2025 | UNH | Buy | +28.8% | Before or on entry | BUY |
Where The Process Broke
A case study that only shows the process working is an ad. These are the places the data says I ignored my own system, skipped it, or got a bad outcome with it.
- The biggest detractor was PYPL (-205 bps), and it had a saved BUY read. The process was present and the outcome was still bad. Reads reduce guessing. They do not remove risk.
- 11 positions in this window have no saved analysis attached (DXJ, VGK, EWJV, IEMG, FLGB, EWC, EWL, EWG, and more). Those buys never went through the pipeline. It is the weakest part of this case study and I am not editing it out.
- DXJ was the best position without a read (+197 bps). That is luck wearing a process costume. It validates nothing.
- I bought NKE, NVDA while the saved read said SELL. The system did its job and I overrode it. Some overrides made money and some lost it. Neither outcome changes the fact that I traded against my own saved work.
What This Does Not Prove
It does not prove Pythia predicts returns. It does not prove the strategy keeps working. It does not prove anyone should copy the trades, and it is a claim about the $800.00 this portfolio ran on, nothing wider. What it shows is narrower and more useful: the system can hold a portfolio decision, the research behind it, and the outcome after it in one place, so a review like this is auditable instead of anecdotal.
Claim Hygiene
- Personal portfolio/project context only.
- Not investment advice or a recommendation to buy, sell, or hold any security.
- Past performance is not predictive of future results.
- Performance and attribution are as of the stated date and depend on available live or cached market data.
- The normalized return method is a proof-case view, not a broker statement or tax/accounting report.
- Extreme trade-timing moves above the public-draft outlier threshold are suppressed until the transaction row is validated.
- The stated $800.00 original-capital basis is a proof-case view of the invested book, not a broker statement of a full account.
- Dollar amounts, position sizes, per-security price fields, account identifiers, and user identifiers are deliberately omitted except for the stated $800.00 basis.
The supporting evidence package retains the calculation notes and public-safe data exports. It omits exact dollar values other than $800.00, position sizes, per-security price fields, emails, and account or user identifiers.