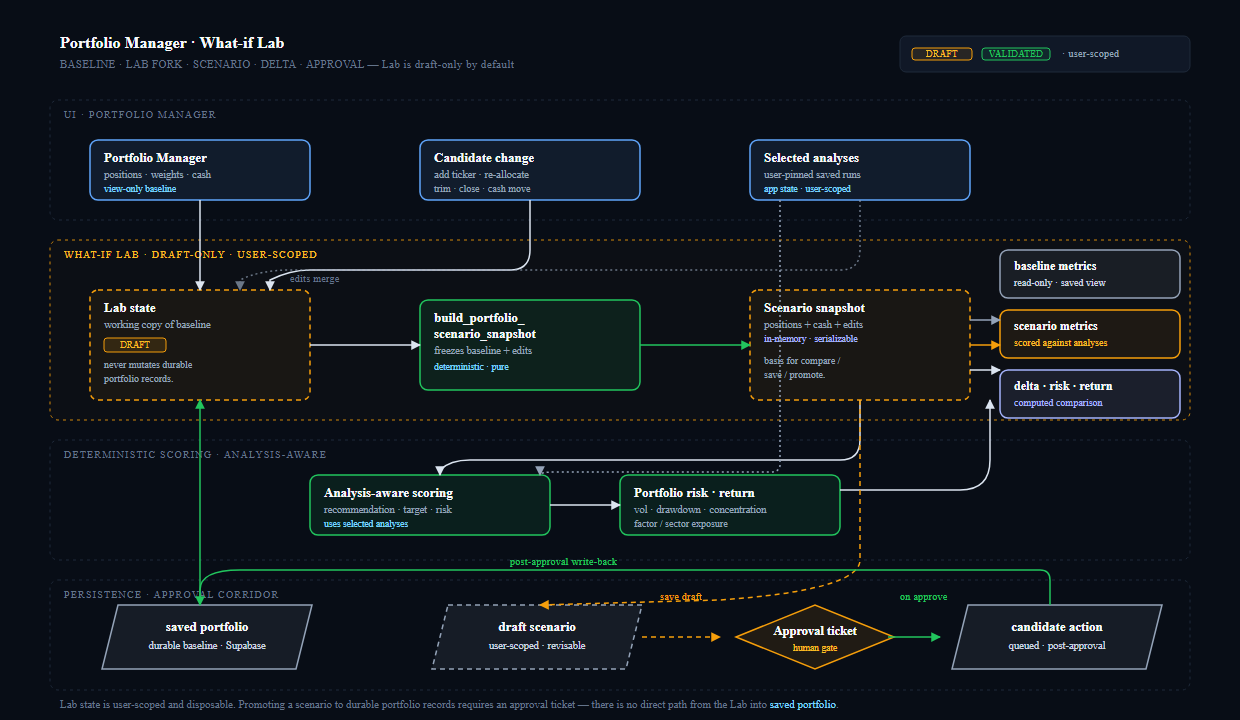
The important adjustment was separating invested-sleeve return from account-level return so a recent cash addition did not bury the actual position story.
Portfolio 8 Report: Turning A Real Portfolio Into An Auditable Case Study
Portfolio 8 is the first public portfolio case study I am using for Pythia Analytics.
The goal is not to show account size or to market investment results. The goal is to show the app doing what it was built to do: connect positions, weights, returns, contribution, thesis text, entry timing, risk evidence, and public-safe publishing artifacts in one repeatable workflow.
What Changed From The Original Carousel
The first version of the carousel was too surface-level. It mostly said that the app had evidence, but it did not make the evidence itself the center of the story.
The current package is report-first:
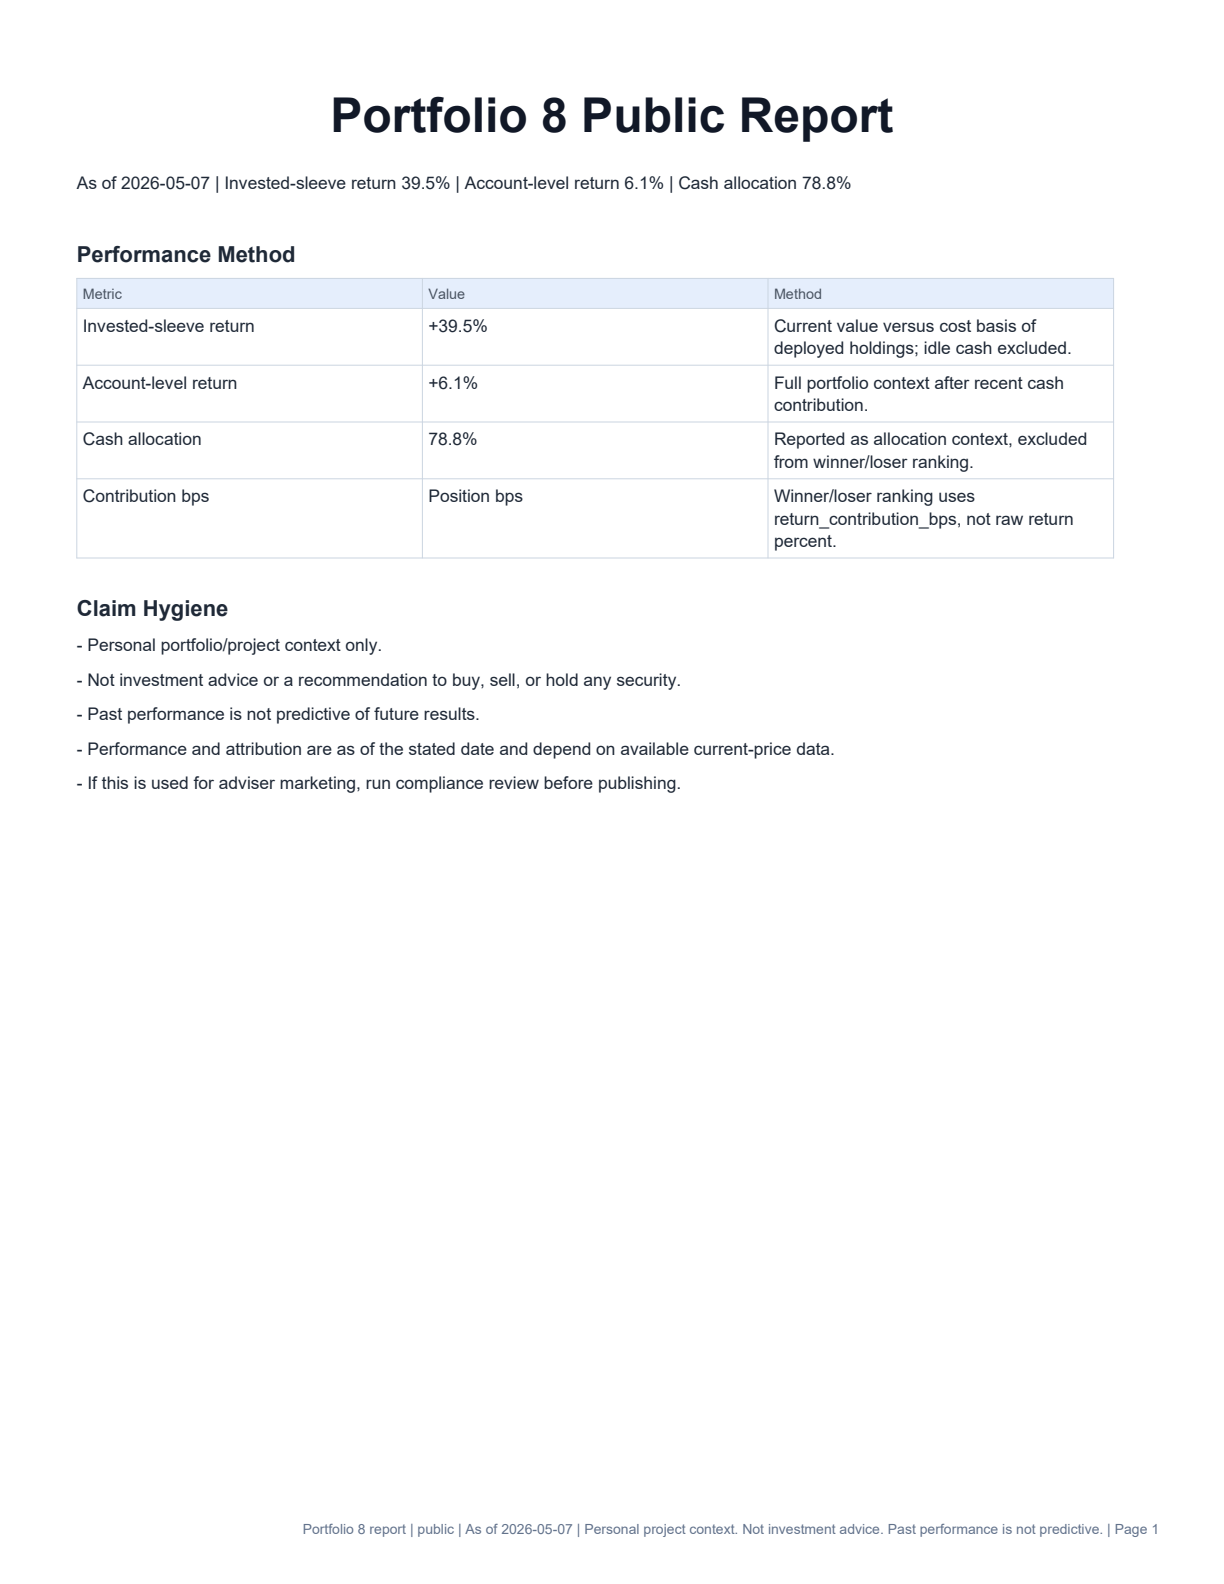
- the public report is the source artifact
- the carousel is a summary artifact derived from the report dataset
- the public dataset removes exact dollar values, share counts, raw prices, account identifiers, and user identifiers
- the internal audit packet is blocked until a real app evidence ZIP is supplied
- the report tables are exported as CSV and Markdown so the claims can be checked outside the PDF
That matters because a portfolio story can become misleading fast if cash flows, position size, and attribution are not separated cleanly.
The Core Performance Issue
The important adjustment was separating invested-sleeve return from account-level return.
Portfolio 8 recently had a large cash addition relative to the original account size. If the story only used account-level return, the added cash would dwarf the actual performance of the invested sleeve.
The report therefore separates:
- invested-sleeve return: +39.5%
- account-level return including idle cash: +6.1%
- cash allocation: 78.8%
- winner/loser ranking: contribution bps, not raw return alone
This is the difference between telling a performance story and telling a capital-flow story.
What The Report Shows
The public report is built around the questions a reader should be able to answer without seeing private account details:
- What was the as-of date?
- When was the portfolio created or first entered?
- When did the last cash flow happen?
- What were the active positions and weights?
- Which holdings contributed most to return?
- Which holdings detracted most?
- What did the saved analysis or curated thesis say near the time of entry?
- Was the original thesis confirmed, contradicted, or still unresolved?
- What did the risk and simulation surfaces add beyond price performance?
The current public winner table is led by GOOG, CAT, NVDA, STLD, and NUE. The detractor table is led by PYPL, NKE, LULU, NOC, and INDA. Those rankings use return contribution in basis points, not raw percentage return.
Why Thesis Timing Matters
The key blog/report improvement is the thesis ledger.
For each holding, the report records the first entry date, nearest saved-analysis date, whether the analysis was pre-entry or a post-entry fallback, the saved signal, thesis excerpt, metrics to watch, thesis breakers, and reconciliation.
That protects the case study from a common problem: using later analysis as if it explained the original decision.
In the public report, later analysis is labeled as a fallback. Pre-entry analysis is labeled separately. That makes the story more honest and more useful.
App Evidence Tables
The app evidence export covers the four tables that matter for this story:
- Expected Returns & Valuation
- Returns Breakdown
- Fundamentals
- Risk & Contribution
It also exports winner/loser attribution, simulation evidence, Monte Carlo summary, and notes. The public report can build without those tables, but the internal audit packet requires the evidence JSON or evidence ZIP so it does not fabricate proof.
The report builder accepts the Dash export directly:
python scripts/build_portfolio_8_report.py --mode both --evidence-zip path\to\portfolio-8-pythia-evidence.zip --render-pages
python scripts/build_linkedin_launch_carousel.py
Public Artifacts
The current launch artifacts live under docs/launch/portfolio-8/:
- Portfolio 8 public report
- Report dataset
- Public report tables
- Rendered public report pages
- LinkedIn carousel PDF
carousel/slides/slide_01.pngthroughslide_09.pngcarousel/tables/*.csvportfolio_8_case_study.mdlinkedin_posts.mdvisual_manifest.md
The public report remains LinkedIn-safe. It includes tickers, weights, percentages, contribution bps, thesis excerpts, timing labels, and claim hygiene. It does not include exact dollars, shares, raw prices, emails, account identifiers, or user identifiers.
What Pythia Makes Visible
The value of this workflow is not just the PDF.
The app makes visible the parts of portfolio review that are usually scattered across memory, broker screens, saved notes, spreadsheets, and hindsight:
- the difference between invested performance and account performance
- whether winners were actually material contributors
- whether losers were thesis-breaking or just small detractors
- whether saved analysis existed before entry
- whether thesis breakers were defined at all
- whether the risk/simulation evidence supports or weakens the narrative
That is the product point of the case study.
Claim Hygiene
Personal portfolio/project context only. Not investment advice or a recommendation to buy, sell, or hold any security. Past performance is not predictive of future results. Performance and attribution are as of the stated date and depend on available current-price data. If this is used for adviser marketing, run compliance review before publishing.